
MLOps at Deep Render, by Saif Haq & Alex Lytchier.
Deep Render is a deep-tech startup that is providing the first deep-learning based image and video codec. As we scaled from a few researchers and engineers to a much larger team, it quickly became apparent that hardware and software abstractions are essential in reducing research bottlenecks. Interestingly there were no reasonable solutions on the market then, or now, that were compatible with our current infrastructure or our research-heavy workflow.
In an ideal world, as a researcher, you should simply request a system with some configuration of hardware components, such as CPUs and GPUs, an appropriate software environment; wait a few seconds, and then immediately SSH into the system to continue your work uninterrupted.
The MLOps division at Deep Render set out to produce such a system for our research division. In this post we will outline how we built our own internal hardware and software management orchestration pipeline.
At Deep Render, we make use of both on-premise and cloud computing. Currently, our on-premise data-centre has over a hundred mixed GPUs partitioned across over thirty physical servers. Much of our hardware was purchased at the peak of the hardware drought, so we possess a broad mix of hardware, ranging from different consumer and server-grade CPUs and motherboards from each server.
All of our servers run on bare metal Linux, utilizing Ubuntu 20.04. This is a robust and widely-supported distribution, and it allows for KVM, a secure and stable hypervisor that can run virtual machines with little overhead. Partitioning physical hosts into virtualized compute is the first step to creating an orchestration platform. This ensures isolated computation between different user sessions and additional levels of security.
Fast iteration of ideas was our principal focus when designing our orchestration platform. As a research company, we don’t have predictable workflows where an ML CI/CD pipeline makes sense, as it does for larger companies like Uber. This is because they have standard networks that are trained, and if they pass the necessary checks, they can be pushed to production and be employed by their users. This is not the case for us. Our researchers need access to a CLI to debug and work in their container as though it was on their local system. Bringing our ML models into production and porting them to mobile is outside the scope of this blog.
Before our platform, researchers used to race to lay claim to the most powerful GPUs by directly SSHing to hosts, and running their models within a custom docker image. If nvidia-smi showed 0% usage, it was considered free game. Yeah … not ideal.
As our datacentre was composed of different hardware, this immediately ruled out Kubernetes-based GPU orchestration solutions like Kubeflow, which other large companies have built upon, i.e. Grid.AI. This is because hardware diversity makes using K8s across different nodes significantly more challenging.
We had already been using wandb.ai to track and monitor experiments and written considerable code to adapt learnt compression to their API. It did not make sense to shift to a new solution that combined experiment and hardware management as a single product. The goal of this project was to focus on the hardware orchestration aspect. We wanted users to be able to request hardware and receive an SSH configuration with everything already sorted. Ideally, the instance would have a static IP, making it possible to connect directly over VSCode’s Remote SSH extension.
So given this information, we set out with the following requirements:
- A docker based environment where a stored image can be used to reproduce experiments and software requirements
- A start-up time of fewer than 10 seconds
- Orchestration works across hosts with entirely different hardware; requesting works via different queues
- Ease of use and minimal work to get access to a terminal with isolated CPU, memory, and GPU
As an initial test, we tried out using ClearML. ClearML’s session seemed to meet all of our requirements and it had a pretty frontend that could be used to manage hosts, and easy partitioning of GPUs into different queues.
However, after some experimentation, we felt that ClearML came with a lot of bloat, which we did not need, even when we specified our own docker image. The start-up time was also prolonged, sometimes up to five minutes (even with cached docker images) - mainly because they download numerous pip packages as part of the start-up process.
We also didn’t like that you had to access containers via port-forwards on the host. We also felt it wasn’t the best designed from a security perspective. Finally, as we didn’t control the orchestration server, we’d be at the mercy of another entity if problems occurred.
Following this experimentation, we set our priorities as:
Security
User experience
Scalability
Monitoring and management
Security
When building our platform, we started from the ground up with security. We are all die-hard fans of Tailscale at Deep Render. We use this to connect to all of our on-prem and cloud instances. It just makes so much sense. This is also how we give our running vessels a static IP, using their ephemeral feature and API token to authorize. Rarely do you encounter software that just works out of the box, no matter where you are and no matter how jank your current network configuration is. It uses Wireguard under the hood and encrypts traffic before communicating between nodes.
You can restrict access of specific ports to certain servers for individual users and groups: It’s like having an advanced netfilter setup on every server, but you only have to manage a single JSON file! Our only problem is with their Magic DNS, which is still in beta, but we can let that slide.
Not only are all hosts completely isolated, and running on bare-metal linux with regular security patches, but we understand that your security is only as good as your weakest component. For this reason, authentication to the different components in the orchestration platform was crucial to get right.
Auth0 is a great solution that we are also very fond of. JWTs are the standard for authentication for modern web applications. They are easy to use, contain use permissions inside the token, and can be issued using OAuth, ie. Google login. Every route in the backend is protected with rule-based access control, ensuring explicit and modular permissions; with many routes requiring multiple. Requesting the token and logging in is just two clicks, so we can ensure tokens have a short lifespan without annoying users too much.
The Deep Render Cloud
We decided to call a running container, a vessel. We envisioned this to be ephemeral and used for a single experiment, although we do not strictly impose this.
The CLI application dubbed Deep Render Cloud (drc) was created to request a compute resource easily. From here, researchers can request, manage and inspect all of their current running vessels.
Upon orchestration completion, the user receives an SSH config from the CLI with a static IP which they may directly connect via SSH, or add to their ~/.ssh/config file. With this, they can make use of VSCode’s Remote SSH, have native linting, debugging, and the ability to work in their private home directory as though they had physical access to the vessel. Vessels also come with a Jupyter server running natively, and can be used as soon as the session is running.
This whole start-up process typically takes 6-9 seconds!
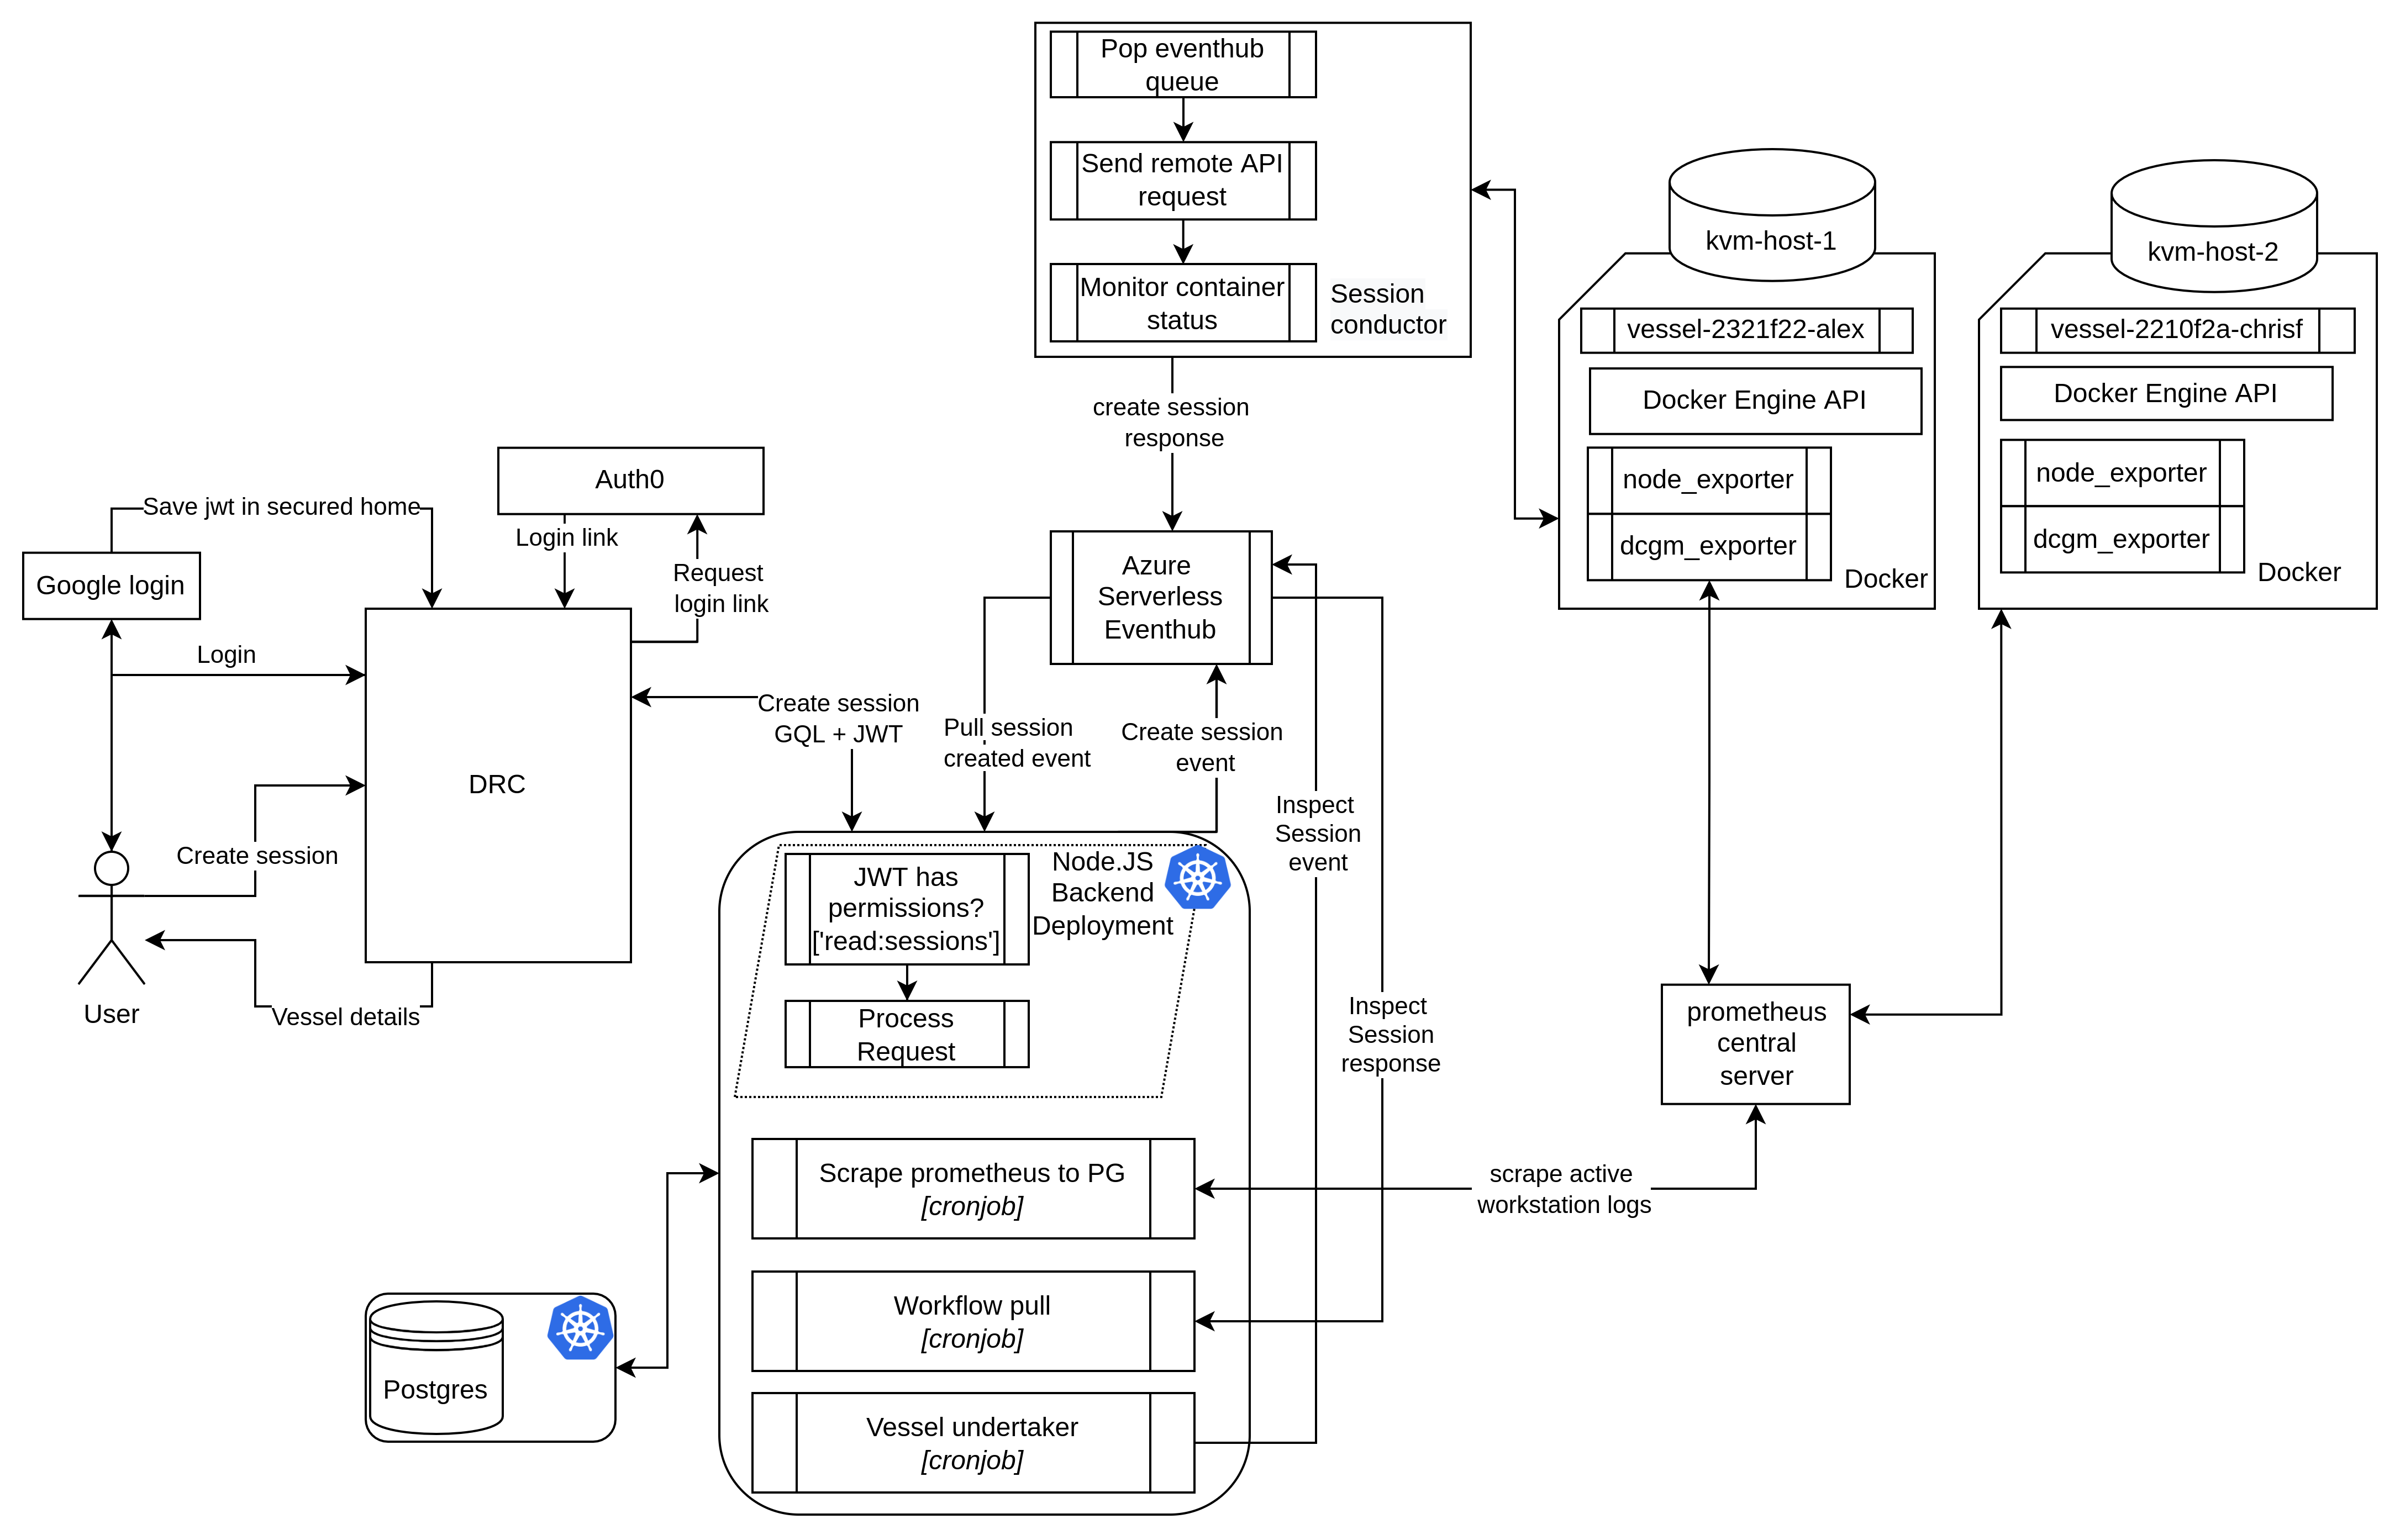
So how does it work? Figure one shows a basic overview of the architecture of our orchestration system.
To request a compute resource, we have developed a CLI application dubbed Deep Render cloud: drc. From here, researchers can request, manage and inspect all of their current running vessels. On a create session route, drc sends a GraphQL request to the Node.js backend.
This determines the most appropriate resources based on the request and reserves them, in a single raw postgres query. The backend then pushes a new request to Azure's managed serverless pub/sub system, EventHub, to forward requests to the session conductor.
The session conductor asynchronously receives the host and vessel details, and sends a command to the remote Docker API over SSH to initialize the container. As part of an asynchronous callback, the session conductor forwards a status update back to the backend.
As the last step in the process, a bespoke token forwarded from the session conductor is used to change the vessel state to running.
Monitoring
Traditionally cloud computing is costly, naturally incentivizing users to be careful wasting compute hours and precious cloud credits. However, for our internal compute resources, how do you ensure researchers make optimal use of the reasons allocated for “free”? We found this to be a complex problem to tackle. Some platforms charge by the hour, while others allow researchers to use the compute until their experiment finishes or crashes. We wanted to be somewhere in between. Take away resources too quickly, and you’re lowering research efficiency; take them away too slow, and you’re once again lowering efficiency, albeit perhaps to a greater extent, since hogging compute resources may become a research bottleneck.
What we settled for is somewhere in between. A microservice run as a cronjob every thirty minutes called the undertaker checks for idle vessels. A vessel is considered idle when it has an average of 0% GPU utilization for six consecutive work hours. After which, researchers receive a Slack message notification. If the vessel remains idle for another six work hours, the undertaker buries the vessel. The undertaker ensures that our GPUs are always hard at work and assigned to research that makes good use of them.
Every so often, a system can misbehave and become unresponsive. To deal with this, we use Nvidia’s DCGM exporter paired with Prometheus to track the current state of GPUs. If a GPU stops exporting logs, the backend asks the session conductor to probe for the current state of the container and updates statuses accordingly. This comes with a friendly Slack message, informing if there is any necessary intervention.
What’s next?
Although a terminal interface is always fantastic, a future project within the MLOps team is providing a sleek and modern web portal for vessel management. All of the big four cloud platform’s portal looks pretty dated and unintuitive. We will build a blazing fast frontend on a modern web stack.
Summary & Conclusion
The Deep Render Cloud powers the research house at Deep Render, allowing us to efficiently manage hundreds of compute resources and, most importantly, making it easy for researchers to conduct research without software or hardware distractions.
RELATED BLOGS

 ARSALAN ZAFAR
- 22 Apr

 LEWIS BRESLIN
- 15 Sep